

Every so often a single number does more work than an entire report. This year, that number is 5.15 per cent.
It comes from recent modelling by Ray White Chief Economist Nerida Conisbee, released in the wake of this year’s Federal Budget decision to remove negative gearing on established properties. Investor lending has already reacted — new investor loan commitments fell sharply in the June quarter, even before the full effect of the policy had time to filter through. The obvious question for anyone holding, or considering, an investment property is simple: what yield do I actually need now?
The number that replaces the tax break
Modelling an 80 per cent loan-to-value ratio, an investor mortgage rate of roughly 6.5 per cent, operating costs at 20 per cent of rent, and an investor on the top marginal tax rate, the analysis lands on a gross rental yield of around 5.15 per cent as the point where an investor’s annual cash position is roughly unchanged from what negative gearing used to deliver. Below that yield, the removal of the deduction is a real, uncushioned cost.
In other words, 5.15 per cent isn’t an arbitrary target — it’s the yield at which the loss of the negative gearing deduction is fully offset by rental income alone. Below that line, an investor is genuinely worse off in cash-flow terms than they were before the Budget change. Above it, the numbers start working the way they used to, just without the tax lever.
For context, most capital city yields currently sit well under this mark. That gap is exactly why this figure has been circulating so widely among agents, brokers and investors this month — it gives people something concrete to measure their own portfolio against, rather than a vague sense that “things feel tighter now.”
- 5.15% is now a more useful benchmark than “positive gearing” for judging whether a purchase still stacks up
- Properties currently yielding well under this level are carrying more of the policy change than the market has fully priced in yet
- SMSF and other higher-yield structures may be less exposed to this shift than standard leveraged residential holds
- This is a modelled hurdle based on specific assumptions — your own rate, LVR and tax position will move the number
What I’d add from the buyer’s side of the desk: this figure is a useful sense-check, but it’s a national average built on a set of assumptions that won’t match every investor’s actual loan or tax position. The real work is running your own numbers against it — property by property, at your actual rate and LVR — rather than assuming the headline figure applies evenly across the board.
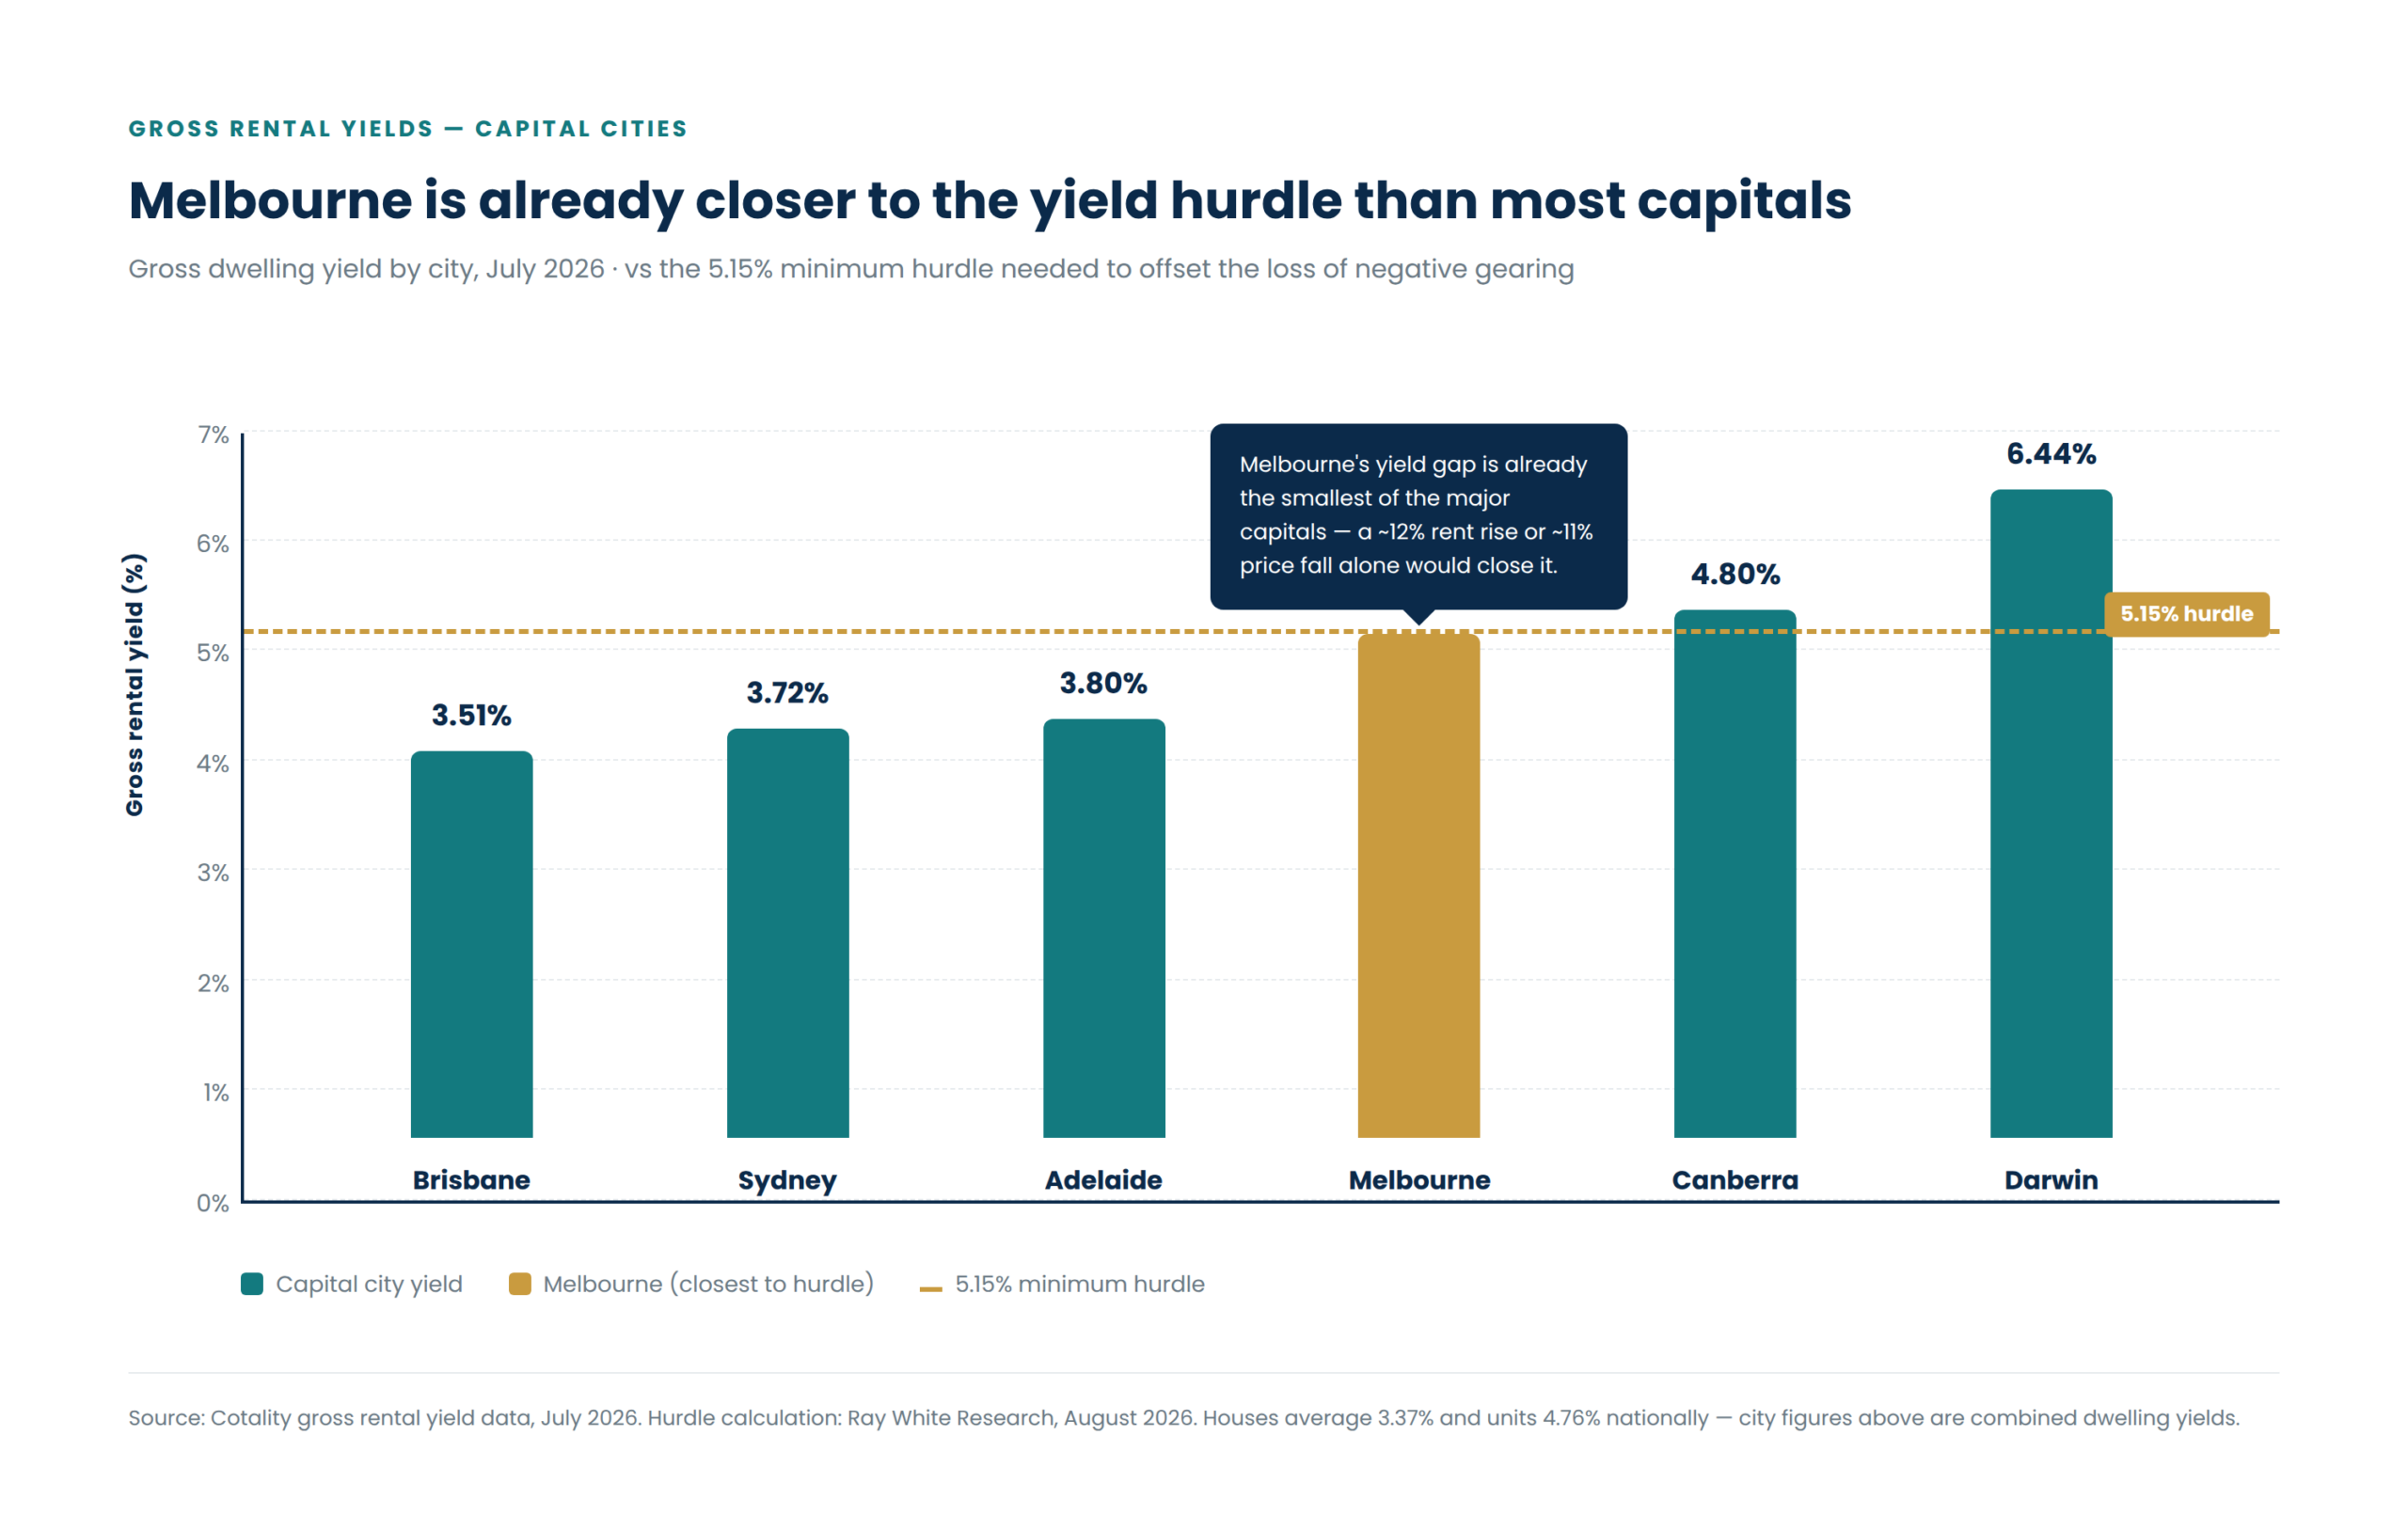
Melbourne is already closer to the yield hurdle than most capitals
Cotality’s July 2026 figures put the combined-capitals gross rental yield at 3.95%, though that masks a big split by property type — houses are averaging just 3.37%, while units sit much higher at 4.76%. The gap between cities is even wider. Brisbane has the weakest dwelling yield of the majors at 3.51%, with Sydney (3.72%) and Adelaide (3.80%) not far ahead. At the other end, Darwin leads the country at 6.44%, and Canberra (4.80%) and Melbourne (4.58%) both sit comfortably above the bottom tier. Melbourne’s position is worth a closer look: years of softer investor demand — driven by higher property taxes and tighter rental regulation — have kept prices subdued while pushing rents up, and the result is a yield that’s already closer to the 5.15% hurdle than any other major capital except Darwin and Canberra. On the numbers, it would only take around a 12% rise in rents, or an 11% fall in prices, for Melbourne to clear that line on its own. The image below explains the point.
Ready to buy investment property. Get in touch with us NOW.

Reference and source – Underlying yield modelling and analysis by Nerida Conisbee, Chief Economist, Ray White. This post draws on one finding from that research; the original piece covers additional scenarios across Sydney, Melbourne, Brisbane and other capitals in more detail.