The Australian property market is famous for its long-term resilience, but it’s not immune to downturns. Sharp corrections have occurred roughly every 7–10 years, driven by interest rate shocks, regulatory tightening, global events, and policy changes.
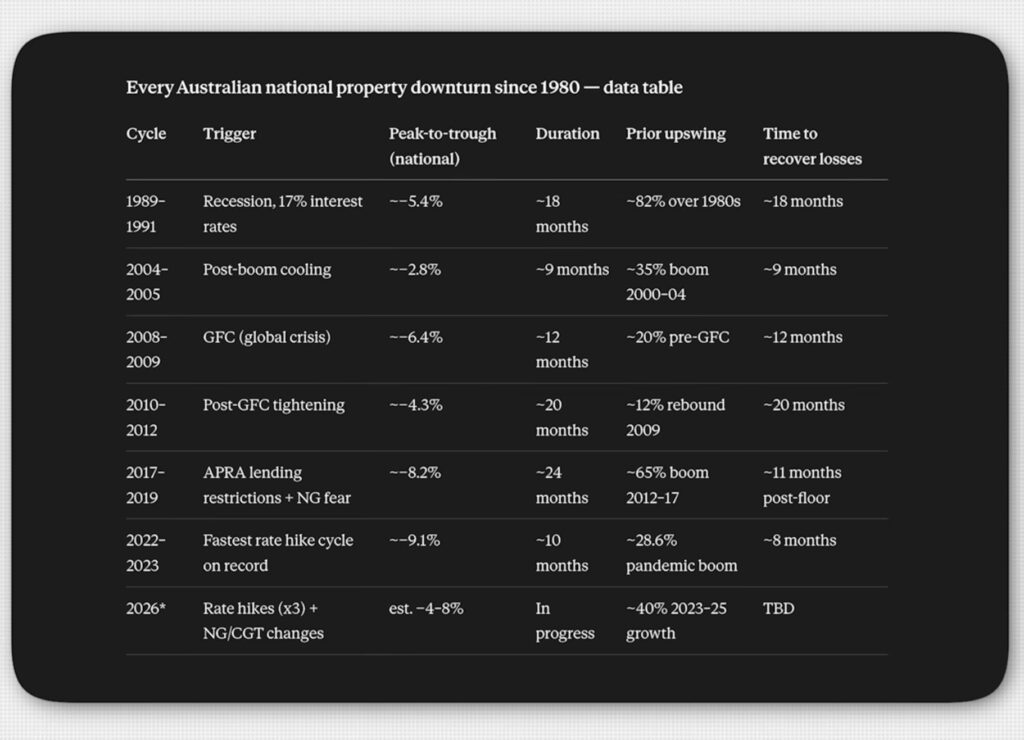
Below is a comprehensive data table summarising every national property downturn since 1980, based on peak-to-trough price declines, duration, prior boom strength, and recovery timelines.
Key Insights from the Data
1. Deeper booms often lead to deeper (but not always longer) corrections The 2017–2019 downturn followed a ~65% boom and saw an 8.2% national drop — one of the sharper corrections. Similarly, the 2022–2023 cycle followed a rapid ~28.6% pandemic-era boom and recorded a 9.1% decline, the largest in the table. The current 2026 cycle comes after ~40% growth from 2023–25, placing it in the upper range of prior booms.
2. Rate hikes are the dominant trigger
- 1989–91: 17% interest rates during recession
- 2022–23: Fastest rate hike cycle on record
- 2026*: Multiple rate hikes plus negative gearing/CGT policy speculation
When the RBA moves aggressively, property feels it quickly.
3. Recovery is often faster than many expect Despite the fear that often accompanies these cycles, national recoveries have historically been swift:
- 2022–23 recovered losses in just ~8 months
- 2017–19 recovered in ~11 months after hitting the floor
- Even the deeper 2008–09 GFC correction took ~12 months
This pattern suggests that once the floor is found, buyer confidence and pent-up demand can drive rapid rebounds.
4. Duration varies significantly The longest downturns were the 2010–2012 (~20 months) and 2017–2019 (~24 months) periods. Shorter, sharper corrections (like 2022–23 at ~10 months) appear more common in recent history.
What Does This Mean for 2026?
The 2026* cycle is currently in progress, with an estimated national peak-to-trough decline of 4–8%. This would place it in the milder-to-moderate category historically — less severe than the 8.2% and 9.1% drops of recent cycles, but still meaningful.
Factors to watch:
- How many more rate hikes (if any) materialise
- The impact of any negative gearing or capital gains tax changes
- Whether the ~40% growth from 2023–25 creates similar vulnerabilities to previous booms
Final Thoughts
Australia’s property market has weathered multiple storms since 1980, and each cycle offers lessons. While downturns can be painful in the short term, they have consistently been followed by recoveries — often quicker than the preceding boom suggested.
For buyers, the current environment represents a strong buyer’s market. With consumer sentiment low, it’s an ideal opportunity to acquire assets at a bargain. Savvy negotiators are securing up to 5% discounts — for example, closing a $700k advertised property at $665k. When the market inevitably picks up in the coming months and shifts back to a seller’s market, those who act now could be sitting on solid equity gains. Based on historical average growth patterns, the same property could realistically reach around $765k within two years — delivering approximately $100k in equity on a well-timed purchase.
For investors and homeowners, this data reinforces the value of a long-term horizon and strong cash flow buffers.
The market rarely moves in straight lines. Understanding these historical patterns helps cut through the noise of daily headlines.
Data compiled from industry sources and national property indices. The 2026 cycle remains ongoing and estimates are subject to change.